Live Queries dashboard
Use the Live Queries dashboard to monitor and display current running queries on your YugabyteDB universes. You can use this data to:
- Visually identify relevant database operations
- Evaluate query execution times
- Discover potential queries for performance optimization
All user roles — Super Admin, Admin, and Read-only — are granted access to use the Live Queries dashboard.
Note
There is no significant performance overhead on databases because the queries are fetched on-demand and are not tracked in the background.Columns description
| Column | Description |
|---|---|
| Node Name | The YB-TServer node name generated by Yugabyte Platform |
| Private IP | The IP Address of the database node |
| Keyspace/Database: | The YCQL keyspace or YSQL database used by the query |
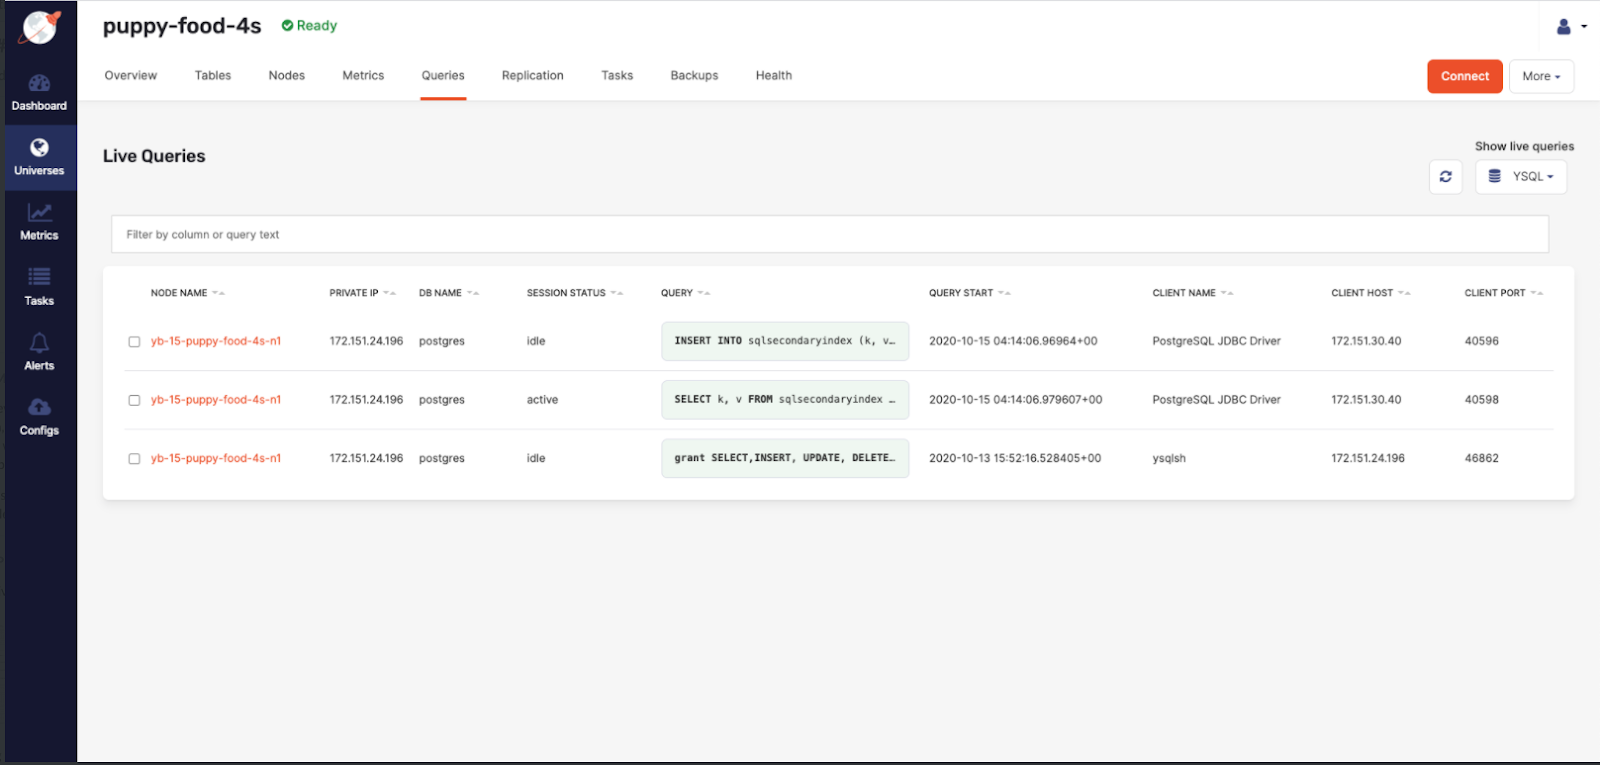
| Session status [YSQL only] | The YSQL session status: idle, active, idle in transaction, fastpath function call, idle in transaction (aborted), or disabled |
| Query | The query command. Example: select * from my_keyspace.my_table |
| Elapsed time | The duration (in milliseconds) of the query handling |
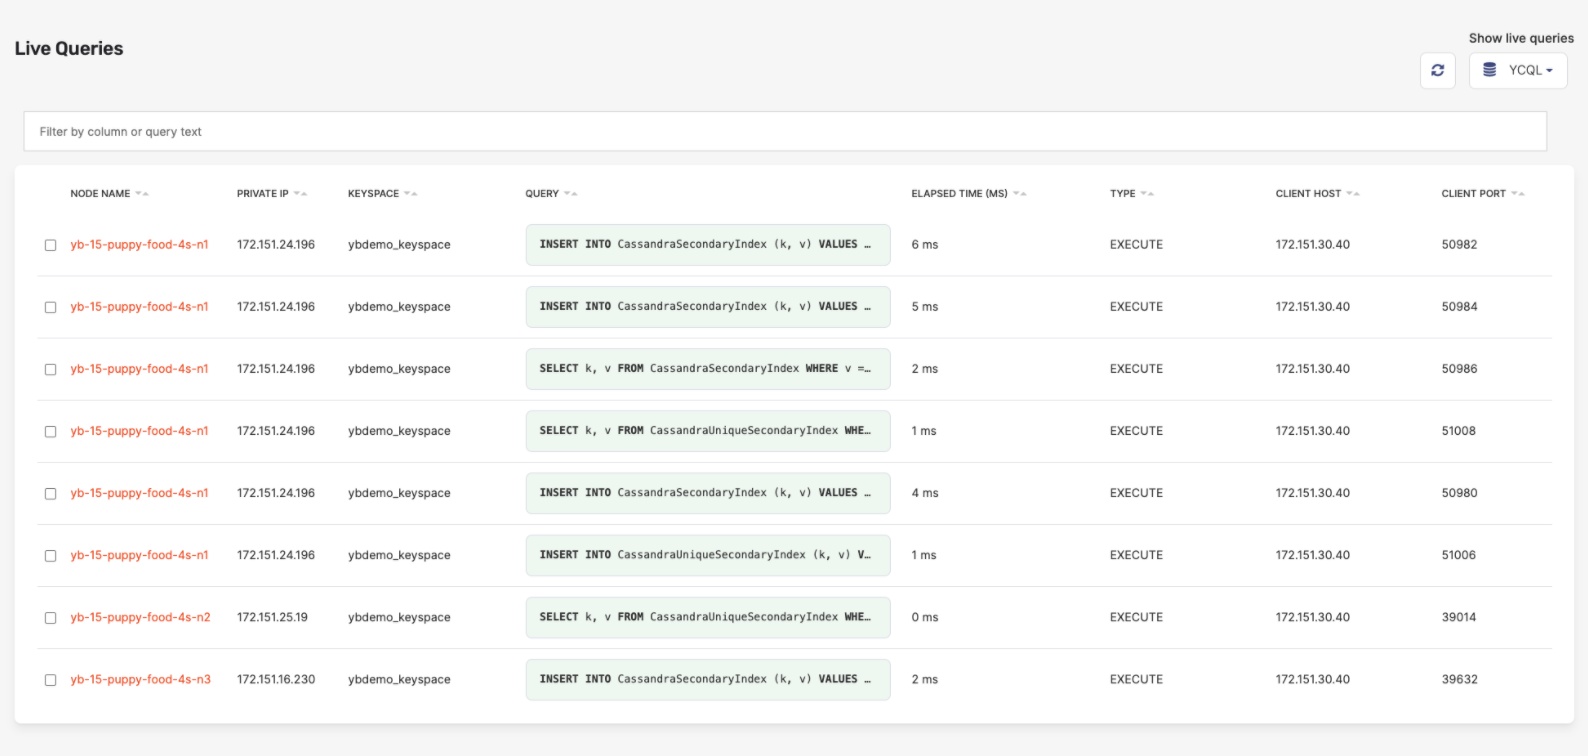
| Type [YCQL only] | Shows the YCQL query type: PREPARE, EXECUTE, QUERY, or BATCH |
| Client host | The address of the client that sent this query |
| Client port | The port of the client that sent this query |
| Client name | The client name used to execute the query |
Use the Live Queries dashboard
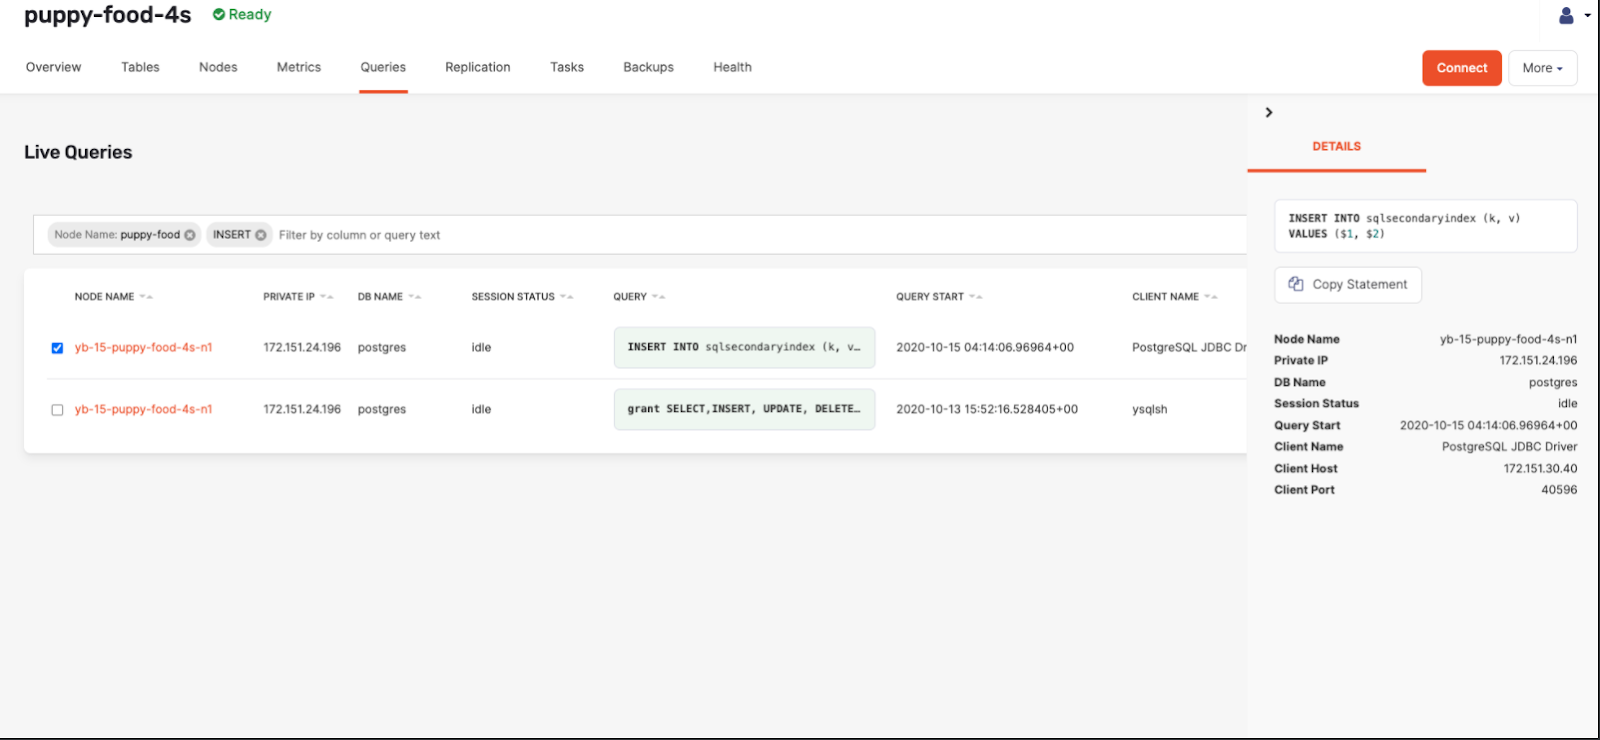
- Go to the Universe Details page and from the Show live queries drop-down list, select YSQL**.
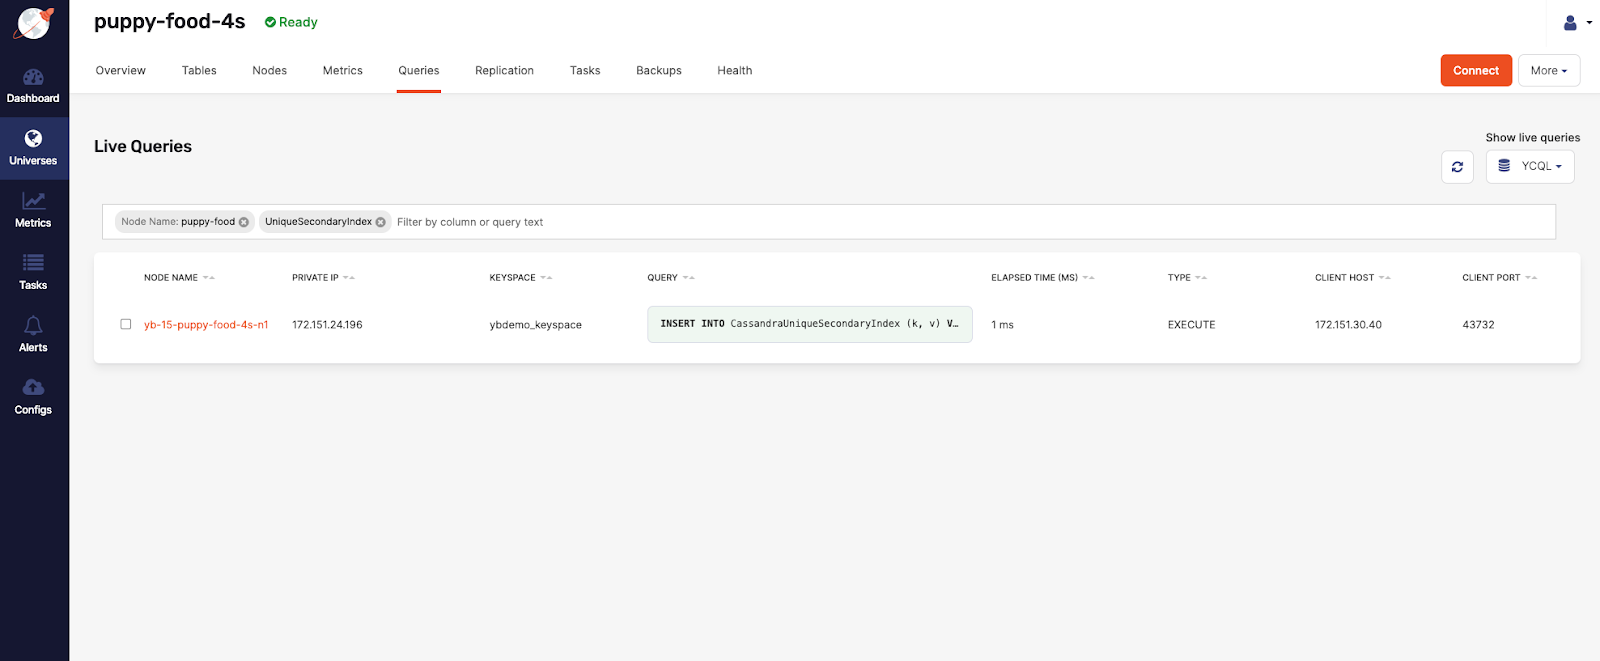
- Changing the Show live queries drop-down selection to YCQL will refresh the data and alter the column headers.
- Click the search bar and the column filter drop-down list appears. The column filter drop-down list lets you use a query language for filtering data based on certain fields.
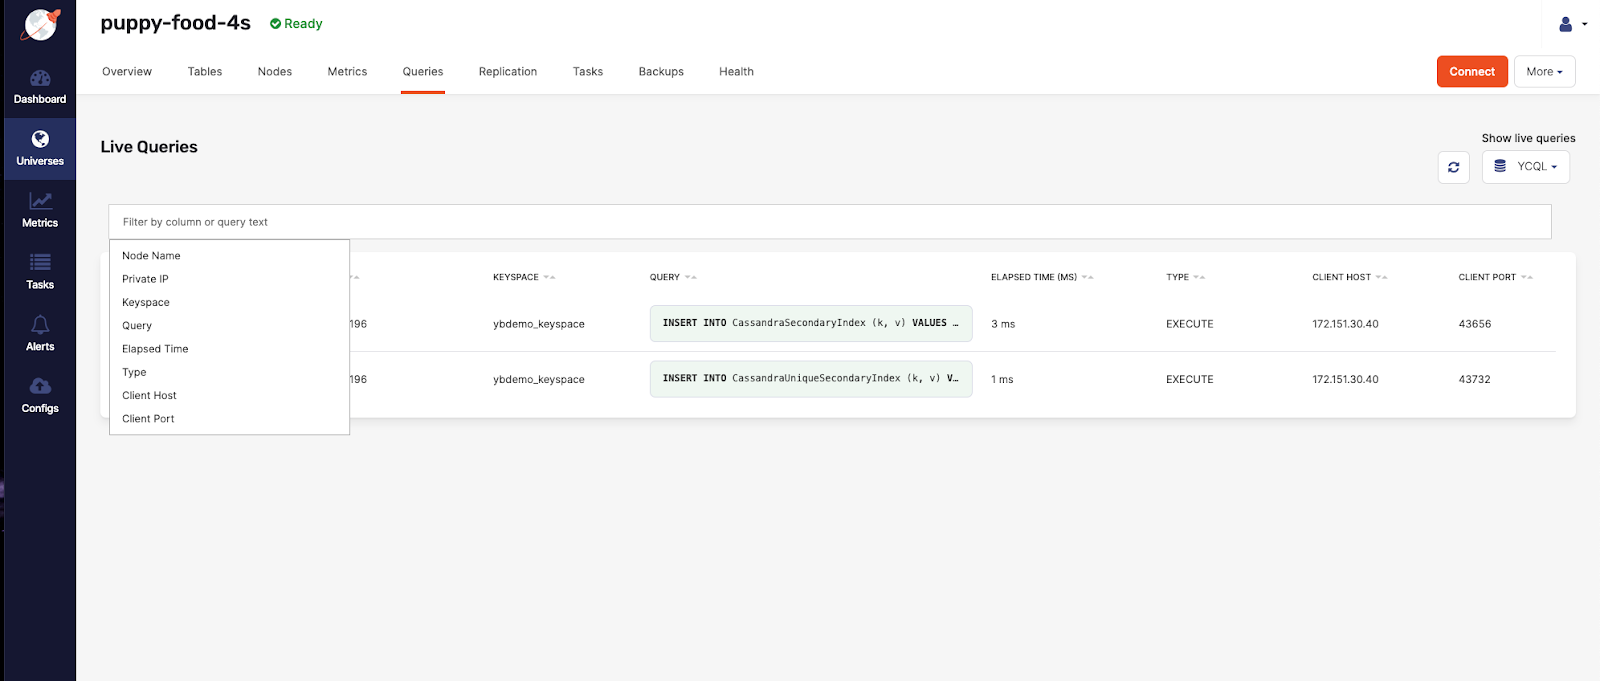
- You can add multiple search terms that are applied as an intersection. In the following example, adding
Node Namewill filter for all rows with a name containingpuppy-foodand have aUniqueSecondaryIndexsomewhere in one of the data cells.
Use filtering for comparisons on numbers columns (Elapsed Time) using >, >=, <, and <= to search for values that are greater than, greater than or equal to, less than, and less than or equal to another value (Elapsed Time: < 50). You can also use the range syntax n..n to search for values within a range, where the first number n is the lowest value and the second n is the highest value. The range syntax supports tokens like the following: n..* which is equivalent to >= n. Or *..n which is the same as <= n.
- Click on a row to open a sidebar with a full view of the query statement, along with all the column data.
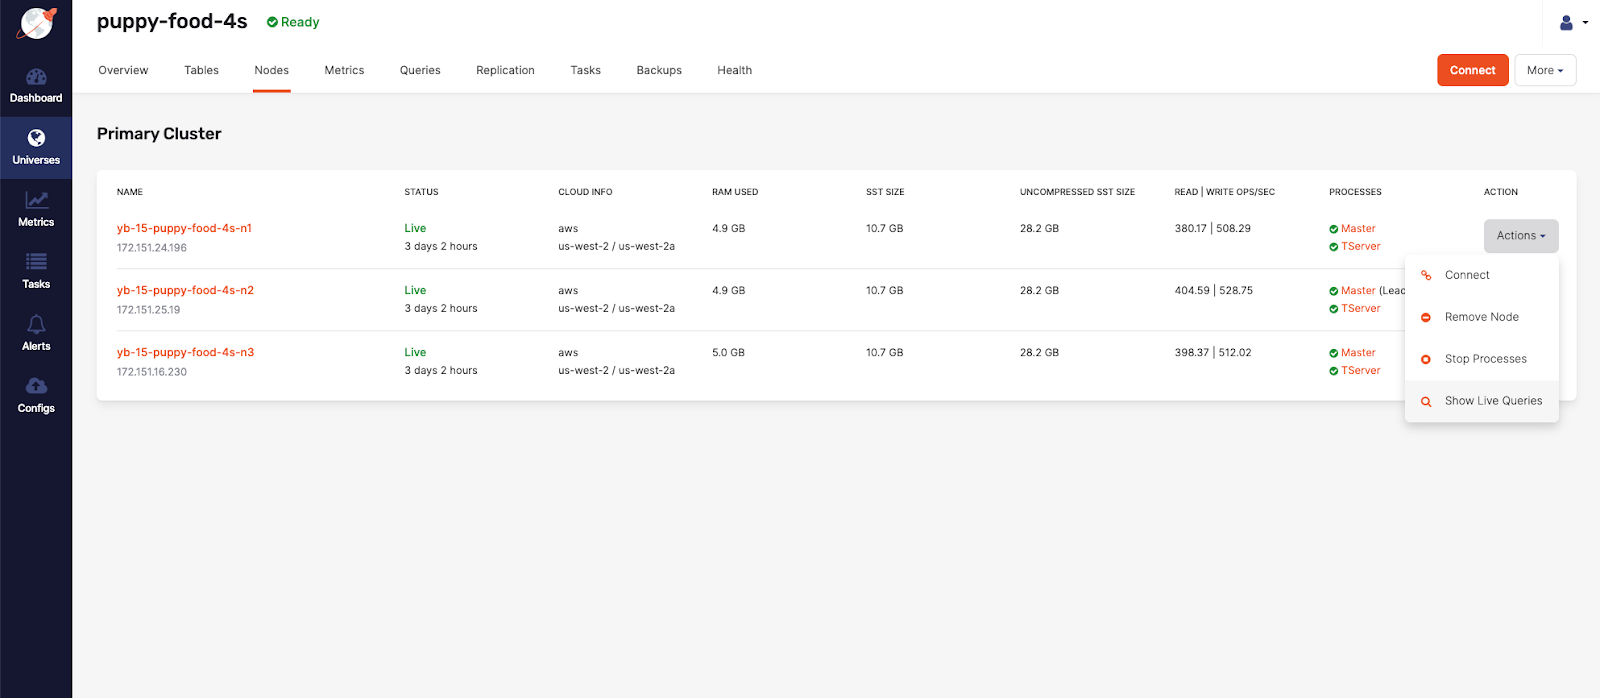
You can also find additional prefiltered navigation links from different pages to the Live Queries page.
- Example: From the Metrics tab to the Queries tab, when the user selects a node from the drop-down list.
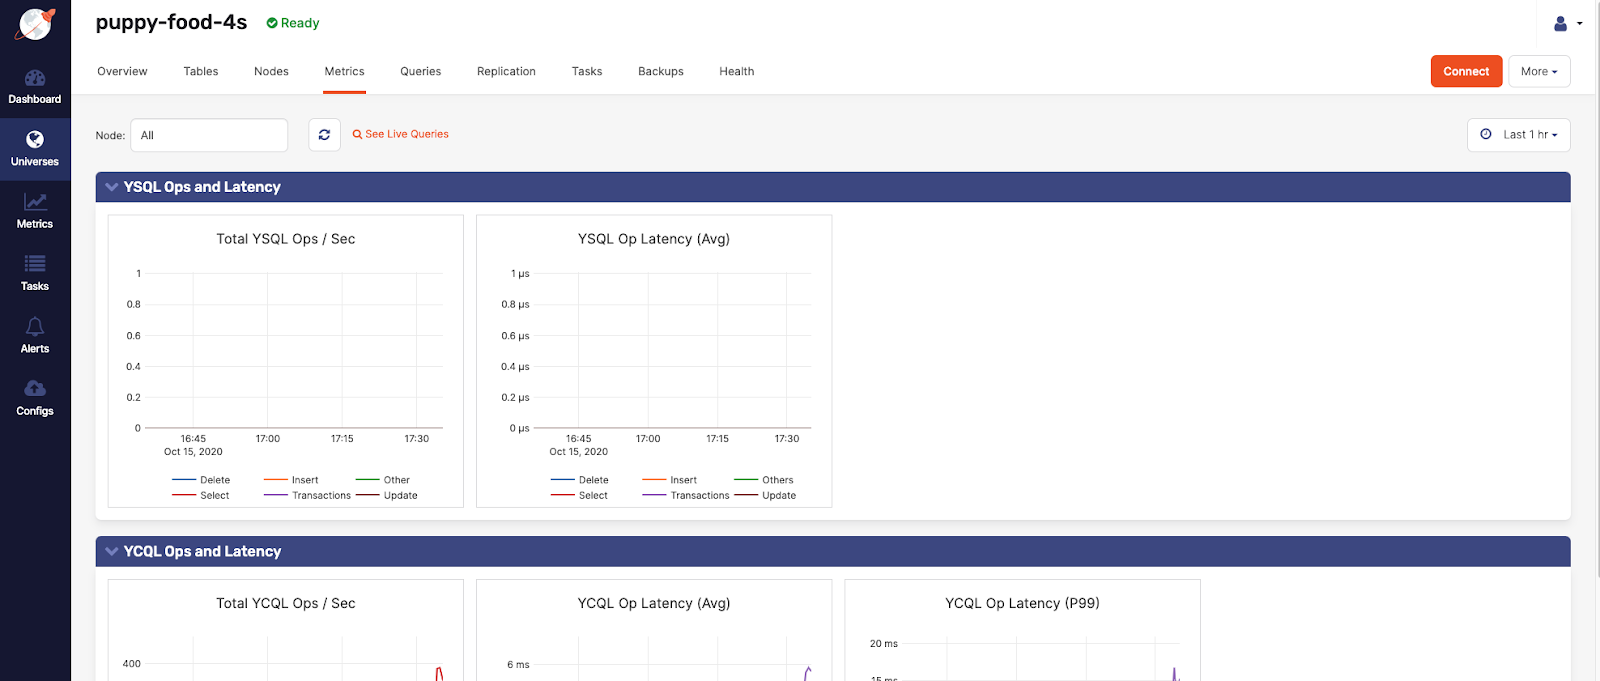
- Example: The Nodes page to link to the Live Queries page, with the specific node prefiltered.